Vet creators before you book
How does a creator perform compared with channels of a similar size? Nindo puts reach and engagement into context and shows comments, follower growth, audience demographics, and brand safety in the channel profile.
Request a demo
- Botting analysis with causes
- Audience demographics
- Add unknown channels by URL
Videos
Best month · Aug 2024
Ø 48,200 ViewsThe figure from the media kit
Today
Ø 21,400 ViewsChannel performance over several years
A media kit shows the numbers from the best month. Nindo shows you how followers, views, and engagement developed over years, updated daily.
The history reveals steady growth, periods of stagnation, and short-term swings in reach and interactions.
- Explanation found
- No explanation found
- Giveaway
Follower spikes with context
A sudden jump in the follower curve can be a giveaway, a press moment, or bought followers. Nindo detects anomalies automatically and assigns them a cause.
If a giveaway post appeared at the same time, for example, that connection becomes visible. You can investigate anomalies with no apparent cause directly.
Compare performance with similar channels
The performance score compares reach and engagement with influencer channels on the same platform in a similar follower range. It uses recorded content from the last 60 days, across languages.
Reach and engagement contribute equally to the score. On Twitch, the score uses live reach. For Instagram and TikTok, you also see comment rate and length compared with similar channels, along with detected comment languages.
Collaboration history for every channel
Automatically detected sponsored posts are attributed to brands to build each channel’s collaboration history.
You can see which brands a creator has worked with, how often they appeared, and how long each collaboration ran.
A reference value for the price negotiation
Based on measured performance, the estimated media value approximates what comparable reach would cost as an ad.
You set the underlying CPM yourself, for example using your internal ad rates. The value remains clearly labeled as an estimate.
Compare sponsored posts separately
A channel with strong organic numbers may perform very differently on sponsored posts. Nindo lets you compare their performance separately from the channel’s organic content.
Up-to-date metrics for every post
Views, likes, comments, and engagement rate are updated daily for every post.


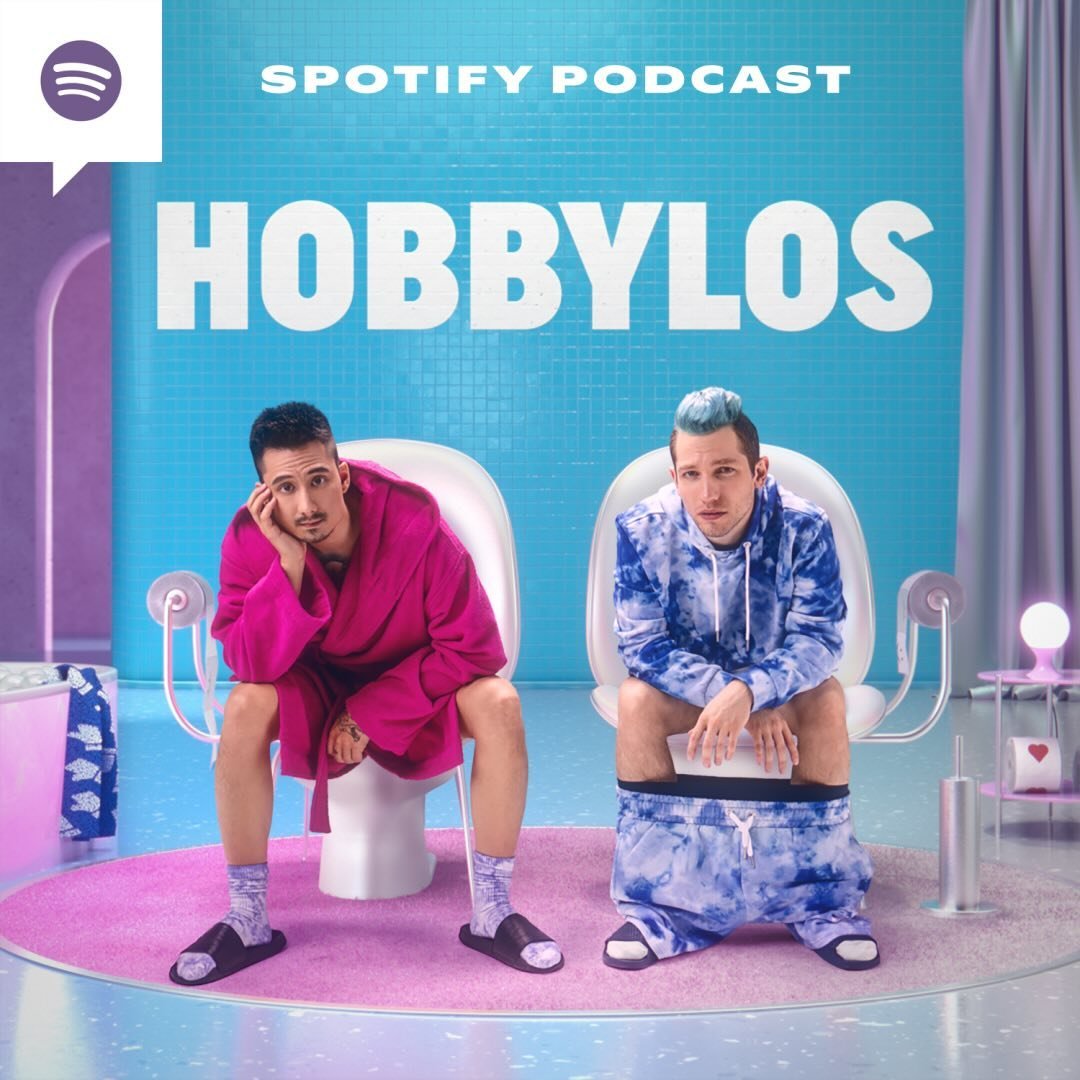












Brand safety flags for every channel
Posts about sensitive topics such as drugs, gambling, politics, and violence are flagged automatically.
Audience by age, gender, and location
Predicted demographics show the audience’s gender, age, and geographic location. You can filter by these values directly in Discovery.
Gender
Age Groups
Distribution of Follower Reach
Distribution of Follower Types
The network behind every channel
Creators recommend each other, tag brands, and get tagged. Nindo shows incoming and outgoing mentions between creators and brands right on the channel.
Julien Bam
15810235Julia Beautx
473914AlphaKevin
841Sashka
66Rewinside
39241Gnu
478RevedTV
5134Mexify
32212Mahluna
38721Kyzer
47Simplicissimus
412








What Nindo evaluates for every channel
- Daily metric updates
- Follower history
- Botting detection
- Performance score and comment comparisons
- Audience demographics
- Brand safety flags
- Sponsored post detection
- Giveaway detection
- Content archive
- Post metrics
- Posting frequency
- Network & environment
More solutions
- Find creatorsCreator search with filters, content search, lookalikes and the Discovery Agent.
- Organize campaignsWatchlists, custom fields and campaign boards for selection and delivery.
- Measure impactAutomated campaign tracking, evaluation and PowerPoint reports.
- Monitor the marketMentions and collaborations related to keywords, accounts and domains.
- PlatformsInstagram, TikTok, YouTube and Twitch in one database.

